
매달, 우리는 1000명 이상의 사람들이 시험 준비를 잘하고 시험을 잘 통과할 수 있도록 도와줍니다.
Salesforce Certified Tableau Consultant 온라인 연습
최종 업데이트 시간: 2025년10월03일
당신은 온라인 연습 문제를 통해 Salesforce Salesforce Certified Tableau Consultant 시험지식에 대해 자신이 어떻게 알고 있는지 파악한 후 시험 참가 신청 여부를 결정할 수 있다.
시험을 100% 합격하고 시험 준비 시간을 35% 절약하기를 바라며 Salesforce Certified Tableau Consultant 덤프 (최신 실제 시험 문제)를 사용 선택하여 현재 최신 55개의 시험 문제와 답을 포함하십시오.
정답:
Explanation:
The calculation DATEPART ('iso-weekday', [Order Date])=1 or DATEPART('iso-weekday', [Order Date])=7is recommended because the ISO standard considers Monday as the first day of the week (1) and Sunday as the last day (7). This calculation will correctly identify Saturdays and Sundays regardless of the locale settings of the workbook’s data source, ensuring that the report includes these days as specified by the client.
References: The use of the ‘iso-weekday’ part in the DATEPART function is consistent with the ISO 8601 standard, which is independent of locale settings. This approach is supported by Tableau’s documentation on date functions and their behavior with different locale settings123.
To accurately identify weekends across different locale settings, using the 'iso-weekday' component is reliable as it is consistent across various locales:
ISO Weekday Function: The ISO standard treats Monday as the first day of the week (1), which makes Sunday the seventh day (7). This standardization helps avoid discrepancies in weekday calculations that might arise due to locale-specific settings.
Identifying Weekends: The calculation checks if the 'iso-weekday' part of the date is either 1 (Sunday) or 7 (Saturday), thereby correctly identifying weekends regardless of the locale settings.
References:
Handling Locale-Specific Settings: Using ISO standards in date functions allows for uniform results across systems with differing locale settings, essential for consistent reporting in global applications.
정답:
Explanation:
The discrepancy between the count of workbooks in the Connected Workbooks tab and the lineage count in Tableau Catalog can occur because of user permissions. In Tableau Data Management, the visibility of
connected workbooks is subject to the permissions set by administrators. If a user does not have permission to view certain workbooks, they will not see them listed in the Connected Workbooks tab, even though these workbooks are part of the data source’s lineage and are counted in Tableau Catalog.
References: This Explanation: is based on the functionality of Tableau Data Management and Tableau Catalog, which includes managing user permissions and access to workbooks. The information is supported by Tableau’s official documentation on data management and security practices1.
정답:
Explanation:
For a performant live connection in Tableau Cloud, especially when dealing with large datasets that preclude the use of extracts, relating the tables in Tableau Desktop is the recommended approach. This method allows for flexibility in how the data is queried and can improve performance by leveraging Tableau’s relationships feature, which optimizes queries for the underlying database.
References: The best practices for live connections in Tableau Cloud suggest using relationships to manage complex data models efficiently1.Additionally, Tableau’s documentation on connecting data sources recommends using relationships for better performance with live connections2.
정답:
Explanation:
The correct calculation to determine the average number of days a customer must wait before a product is shipped is to first find the shipping date, which is the first day of the following month after the order date. This is done using DATETRUNC ('month', DATEADD ('month', 1, [Order Date])). Then, the average difference in days between the order date and the shipping date is calculated using AVG (DATEDIFF ('day', [Order Date], [Calc1])). This approach ensures that the average wait time is calculated in days, which is the most precise measure for this scenario.
References: The solution is based on Tableau’s date functions and their use in calculating differences between dates, which are well-documented in Tableau’s official learning resources and consultant documents12.
To calculate the average waiting days from order placement to shipping, where shipping occurs on the first day of the following month:
Calculate Shipping Date (Calc1): Use the DATEADD function to add one month to the order date, then apply DATETRUNC to truncate this date to the first day of that month. This represents the shipping date for each order.
Calculate Average Wait Time (Calc2): Use DATEDIFF to calculate the difference in days between the original order date and the calculated shipping date (Calc1). Then, use AVG to average these differences across all orders, giving the average number of days customers wait before their products are shipped.
References:
Date Functions in Tableau: Functions like DATEADD, DATETRUNC, and DATEDIFF are used to manipulate and calculate differences between dates, crucial for creating metrics that depend on time intervals, such as customer wait times in this scenario.
정답:
Explanation:
The correct calculation for classifying profit margins into categories based on specified thresholds involves the use of conditional statements that check ranges in a logical order:
Highly Profitable Classification: The first condition checks if the profit margin is 50% or more. This must use the ">=" operator to include exactly 50% as "Highly Profitable".
Profitable Classification: The next condition checks if the profit margin is between 0% and 50%. Since any value falling at or above 50% is already classified, this condition only needs to check for values greater than or equal to 0%.
Unprofitable Classification: The final condition captures any remaining scenarios, which would only be values less than 0%.
References:
Logical Order in Conditional Statements: It is crucial in programming and data calculation to ensure that conditions in IF statements are structured in a logical and non-overlapping manner to accurately categorize all possible values.
정답:
Explanation:
When a filter is applied directly to the view, it can affect the calculation of percentages in a histogram because it changes the underlying data that the quick table calculation is based on. To avoid this, adding the [Profit] filter to the context will maintain the original calculation of percent shares while filtering out bins with less than a 15% share. This is because context filters are applied before any other calculations, so the percent shares calculated will be based on the context-filtered data, thus preserving the integrity of the original percent labels.
References: The solution is based on the principles of context filters and their order of operations in Tableau, which are documented in Tableau’s official resources and community discussions123.
When a histogram is created showing the distribution of profits with labels indicating percent shares using a quick table calculation, and a need arises to limit the view to bins with at least a 15% share, applying a standard profit filter directly may undesirably alter how the percent labels calculate because they depend on the overall distribution of data. Placing the [Profit] filter into the context makes it a "context filter," which effectively changes how data is filtered in calculations:
Create a Context Filter: Right-click on the profit filter and select "Add to Context". This action changes the order of operations in filtering, meaning the context filter is applied first.
Adjust the Percent Calculation: With the profit filter set in the context, it first reduces the data set to only those profits that meet the filter criteria. Subsequently, any table calculations (like the percent share labels) are computed based on this reduced data set.
View Update: The view now updates to display only those bins where the profits are at least 15%, and the percent share labels recalculated to reflect the distribution of only the filtered (contextual) data.
References:
Context Filters in Tableau: Context filters are used to filter the data passed down to other filters, calculations, the marks card, and the view. By setting the profit filter as a context filter, it ensures that calculations such as the percentage shares are based only on the filtered subset of the data.
정답:
Explanation:
Given the need for up-to-date data on a daily basis and weekly revisions, the best approach is to use an incremental extract refresh daily to update the data source with new transactions. On Saturdays, when incorrect transactions are revised, a full extract refresh should be performed to incorporate all revisions and ensure the data’s accuracy. This strategy allows end users to have access to the most current data throughout the week while also accounting for any necessary corrections12.
References: The solution is based on best practices for managing data sources in Tableau Server, which recommend using incremental refreshes for frequent updates and full refreshes when significant changes or corrections are made to the data12.
정답:
Explanation:
To track which data sources are used most frequently across a site in Tableau Cloud, the client should use the GraphiQL engine and the Metadata API. The GraphiQL engine allows for interactive exploration of the metadata, making it easier to construct and test queries1.The Metadata API provides access to metadata and lineage of external assets used by the content published to Tableau Cloud, which is essential for tracking data source usage2.
References: The actions are based on the capabilities of the GraphiQL engine and the Metadata API as described in Tableau’s official documentation and learning resources321.
정답:
Explanation:
When “Apply to Nested Projects” is checked in Tableau Server, the permission rules set at the top-level project are enforced for all assets in the project and all nested projects. This means that any custom access previously granted to nested projects will be overridden, and the permissions will revert to those defined at the top-level project. This action ensures consistent application of the data governance strategy across all divisions.
References: The impact of checking “Apply to Nested Projects” is detailed in Tableau’s official documentation, which explains how locked nested projects can be used to govern site content with greater flexibility and efficiency12.
정답:
Explanation:
When considering a migration from Tableau Server to Tableau Cloud, two critical factors to consider are the client’s need for single sign-on (SSO) and the volume of concurrent extract refreshes.
Single Sign-On (SSO): Tableau Cloud supports SSO, which can streamline user authentication and enhance security.If the client plans to leverage SSO, Tableau Cloud may be a suitable choice1.
Concurrent Extract Refreshes:The number of concurrent extract refreshes is a significant factor because it impacts performance and resource allocation.Tableau Server might be more appropriate if the client
has a high volume of concurrent extract refreshes, as it allows for more control over the infrastructure to manage these workloads2.
References: The decision between Tableau Server and Tableau Cloud should be based on specific organizational needs, including security, compliance, performance, and scalability.The official Tableau resources provide guidance on these factors12.Additionally, discussions in the Tableau Community highlight the importance of considering these elements when choosing between Tableau Server and Tableau Cloud1.
정답:
Explanation:
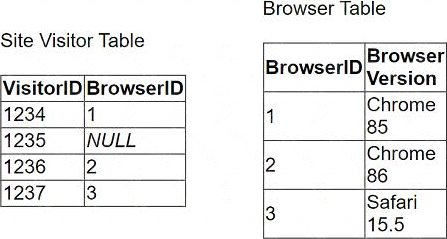
To improve the performance of a Tableau dashboard while maintaining accurate counts, particularly when dealing with unknown or NULL BrowserIDs in the data tables, the following steps are recommended:
Modify the Browser Table: Add a new row to the Browser Table labeled "Unknown," assigning it a unique BrowserID, e.g., 0 or 4.
Update the Site Visitor Table: Replace all NULL BrowserID entries with the BrowserID assigned to the "Unknown" entry. This ensures every record in the Site Visitor Table has a valid BrowserID that corresponds to an entry in the Browser Table.
Change Referential Integrity Setting: Change the Referential Integrity setting from "Some Records Match" to "All Records Match." This change assumes all records in the primary table have corresponding records in the secondary table, which improves query performance by allowing Tableau to make optimizations based on this assumption.
References:
Handling NULL Values: Replacing NULL values with a valid unknown option ensures that all data is included in the analysis, and integrity between tables is maintained, thereby optimizing the performance and accuracy of the dashboard.
정답:
Explanation:
The calculation {FIXED [Customer ID], [Region]: COUNTD ([Order ID])}is the correct one to use for this scenario. This Level of Detail (LOD) expression will calculate the distinct count of orders for each customer within each region, which is then averaged per month. This approach ensures that the average number of orders per customer is accurately calculated for each region and then broken down by month, aligning with the client’s expectations.
References: The LOD expressions in Tableau allow for precise control over the level of detail at which calculations are performed, which is essential for accurate data analysis. The use of{FIXED}expressions to specify the granularity of the calculation is a common practice and is well-documented in Tableau’s official resources12.
The initial calculation provided by the client likely overestimates the average number of orders per customer per month by region due to improper granularity control. The revised calculation must take into account both the customer and the region to correctly aggregate the data:
FIXED Level of Detail Expression: This calculation uses a FIXED expression to count distinct order IDs for each customer within each region. This ensures that the count of orders is correctly grouped by both customer ID and region, addressing potential duplication or misaggregation issues.
Accurate Aggregation: By specifying both [Customer ID] and [Region] in the FIXED expression, the calculation prevents the overcounting of orders that may appear if only customer ID was considered, especially when a customer could be ordering from multiple regions.
References:
Level of Detail Expressions in Tableau: These expressions allow you to specify the level of granularity you need for your calculations, independent of the visualization's level of detail, thus offering precise control over data aggregation.
정답:
Explanation:
To improve the performance of a Tableau workbook, it is best practice to streamline the data being used. This can be achieved by using filters to limit the data to only what is necessary for analysis, hiding fields that are not being used to reduce the complexity of the data model, and aggregating values to simplify the data and reduce the number of rows that need to be processed. These steps can help reduce the load on the server and improve the speed of the workbook.
References: The best practices for optimizing workbook performance in Tableau are well-documented in Tableau’s official resources, including the Tableau Help Guide and the Designing Efficient Workbooks whitepaper, which provide detailed recommendations on how to streamline workbooks for better performance12.
정답:
Explanation:
When field agents are unable to access workbooks due to issues with security token-based credentials, the most immediate and least disruptive solution is to renew the security token. This can be done through the Data Connection settings on Tableau Server. Renewing the token will restore access for the field agents without requiring them to take any action or affecting other users.
References: The use of personal access tokens (PATs) in Tableau and the procedure for renewing them are documented in Tableau’s official resources. It is noted that PATs are long-lived authentication tokens that can be revoked and renewed to manage access securely1.Additionally, there have been discussions in the Tableau Community regarding issues with concurrent PAT access, which further supports the need to manage tokens effectively2.
정답:
Explanation:
When migrating content between Tableau servers, certain types of content may require special consideration or different tools for migration:
Tableau Prep Flows: These are specific to Tableau Prep and are not included in the standard content migration capabilities of the Tableau Content Migration Tool. Tableau Prep flows often require separate processes for migration due to their distinct setup and integration with data sources and workflows.
Published Data Sources and Workbooks: These can typically be migrated directly using the Tableau Content Migration Tool, which supports moving published data sources (both live connections and extracts) and workbooks without requiring additional tools.
References:
Tableau Help and Support: Offers comprehensive tutorials and guidelines on using different tools for migrating various types of content, including the specific requirements for migrating Tableau Prep flows which are not covered by the standard content migration tool.