Microsoft Power Platform Fundamentals (beta) 온라인 연습
최종 업데이트 시간: 2025년10월07일
당신은 온라인 연습 문제를 통해 Microsoft PL-900 시험지식에 대해 자신이 어떻게 알고 있는지 파악한 후 시험 참가 신청 여부를 결정할 수 있다.
시험을 100% 합격하고 시험 준비 시간을 35% 절약하기를 바라며 PL-900 덤프 (최신 실제 시험 문제)를 사용 선택하여 현재 최신 48개의 시험 문제와 답을 포함하십시오.
/ 5
Question No : 1
DRAG DROP
A company is building a Power Apps portal.
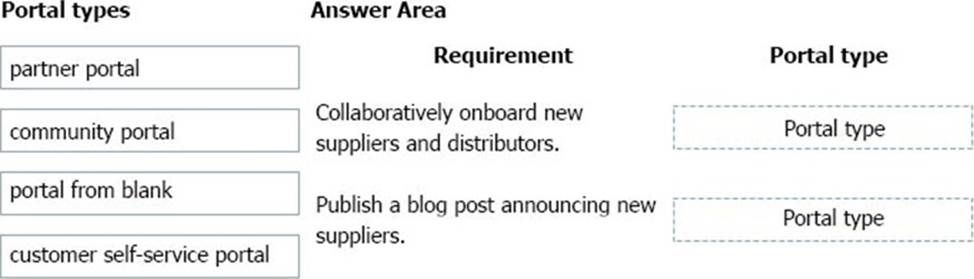
You need to select out-of-the-box portal types to meet the company's requirements.
Which portal types should you use? To answer, drag the appropriate portal types to the correct requirements. Each portal type may be used once, more than once, or not at all. You may need to drag the split bar between panes or scroll to view content. NOTE: Each correct selection is worth one point.
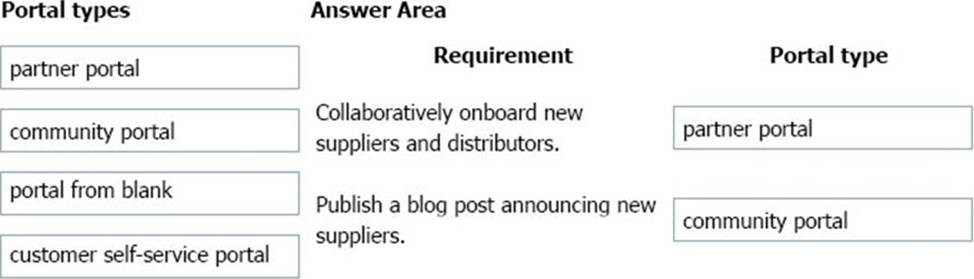
정답:
Explanation:
Box 1: Partner portal
A partner portal allows every organization with resellers, distributors, suppliers, or partners to have real-time access to every stage of shared activities.
Box 2: Community portal
A community portal leverages peer-to-peer interactions between customers and experts to organically grow the catalog of available knowledge from knowledge base articles, forums, and blogs as well as providing feedback through comments and ratings.
Incorrect Answers:
- Portal from blank: Create a website to share data with external and internal users. This template comes with sample pages to get you quickly started.
- Customer self-service portal: A customer self-service portal enables customers to access self-service knowledge, support resources, view the progress of their cases, and provide feedback.
Reference: https://docs.microsoft.com/en-us/powerapps/maker/portals/portal-templates
Question No : 2
You are creating visuals in Power BI.
You create area charts, pie charts, and donut charts that use your company’s data.
You need to display the charts to others at the company.
Which two objects can you add the charts to? Each correct answer presents a complete solution. NOTE: Each correct selection is worth one point.
You are a district manager for a large retail organization. You train each store manager to use Power BI to track sales and daily sales targets.
A store manager remembers learning about the Analyze in Excel option but cannot find the option in their Power BI dashboard.
You need to help the user resolve the issue.
How should you advise the user?
DRAG DROP
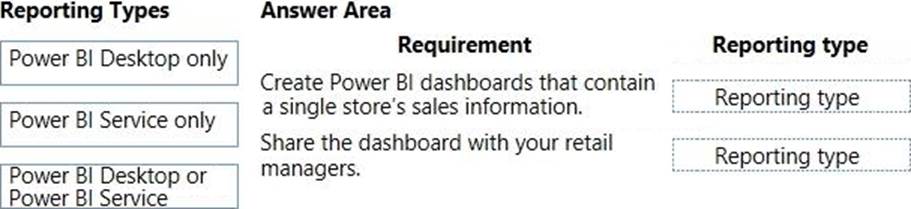
You are a district manager for a large retail company. You want to provide sales managers with deeper sales insights to ensure that they can make more informed decisions for their stores.
Store managers must be able to view data in near real-time.
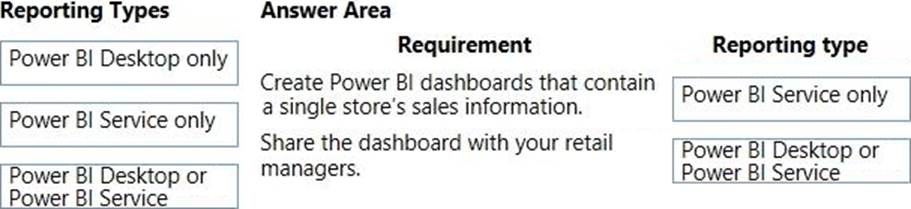
You need to create and share a Power Bl dashboard that can be used by the store managers.
Which tools can you use? To answer, drag the appropriate reporting types to the correct requirements. Each reporting type may be used once, more than once, or not at all. You may need to drag the split bar between panes or scroll to view content.
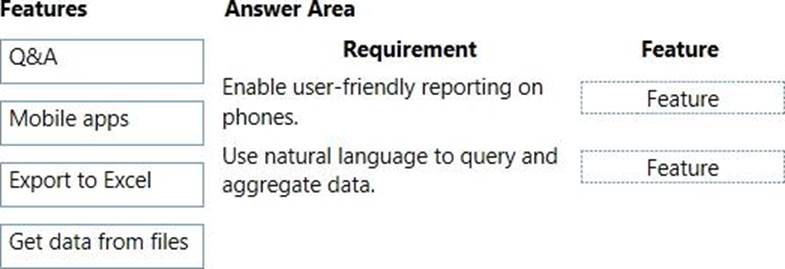
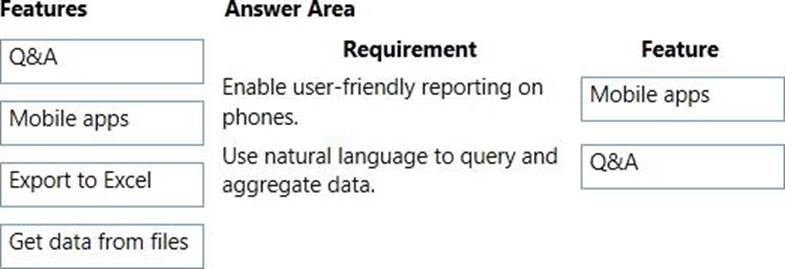
DRAG DROP
A company uses Microsoft Excel workbooks to store consolidated sales data. Workbooks are stored on OneDrive for Business.
Match each Power Bl feature to its requirement. To answer, drag the appropriate features from the column on the left to its requirement on the right. Each option may be used once, more than once, or not at all. NOTE: Each correct match is worth one point.
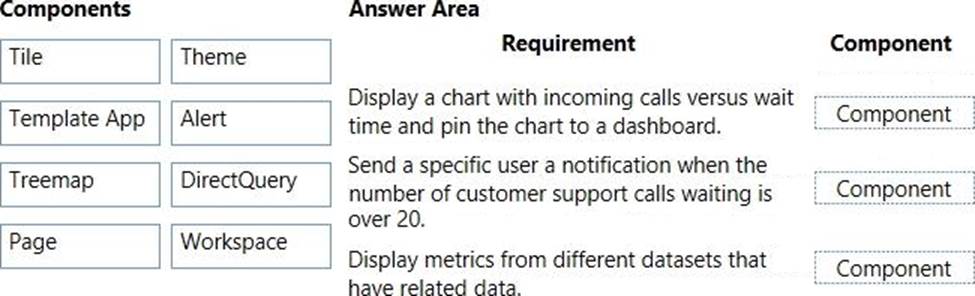
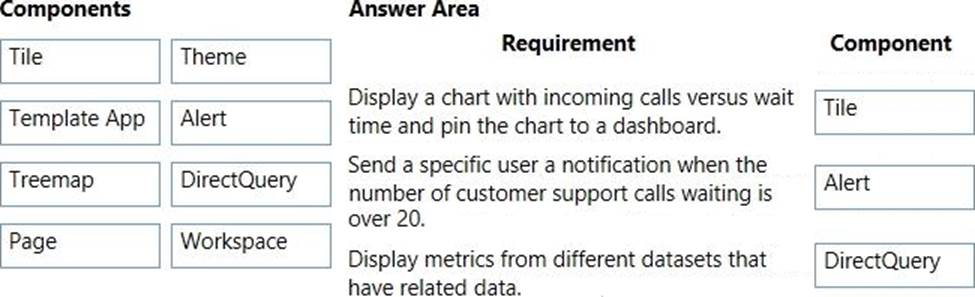
DRAG DROP
A company plans to display support call metrics on a screen that is visible to all call center staff.
You need to recommend solutions to meet the company's requirements.
What should you recommend? To answer, drag the appropriate components to the correct requirements. Each component may be used once, more than once, or not at all. You may need to drag the split bar between panes or scroll to view content. NOTE: Each correct selection is worth one point.
You create a Power Bl dashboard that displays Common Data Model data. You need to share the Power Bl dashboard with coworkers and allow the coworkers to collaborate.
What are two possible ways to achieve the goal? Each correct answer presents a complete solution. NOTE: Each correct selection is worth one point.
You are using Dynamics 365 Sales.
You need to create a Power BI report that includes customer office locations. The City and State columns
must be combined to form one column on the report.
What should you do?
You need to display sales orders greater than a specific threshold in a Power Bl report.
What should you use?
정답:
Question No : 10
You are a sales representative. You create a Power BI report to visualize data from a Microsoft Excel
workbook.
Users need to be able to view and share the report.
Which two actions should you perform? Each correct answer presents part of the solution. NOTE: Each correct selection is worth one point.
HOTSPOT
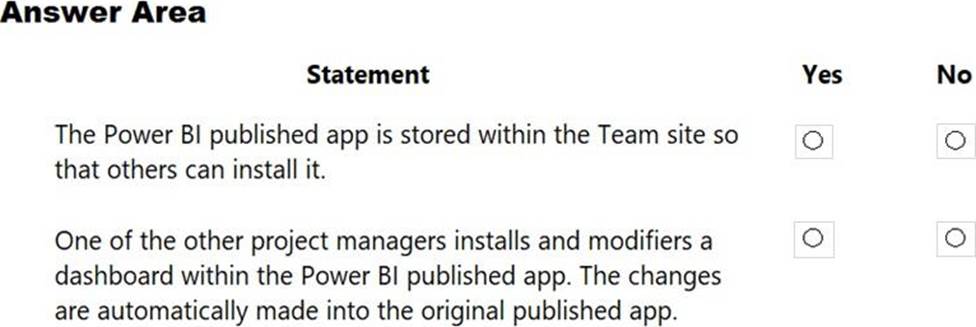
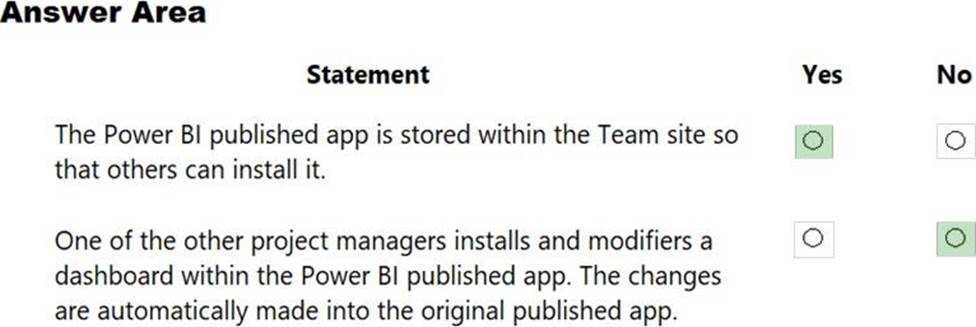
You create reports within Power BI to report on the status of a project. A manager asks you to share the reports with other team members. You decide to create a published app and set permissions to allow other team members to view the reports.
For each of the following statements, select Yes if the statement is true. Otherwise, select No. NOTE: Each correct selection is worth one point.
A carpet cleaning company uses Dynamics 365 Sales.
The process for entering customer information during onsite sales calls is very complicated. The company
wants a simplified screen that allows salespeople to capture the customer name, phone number, and other information while speaking to the customer.
You need to recommend a solution that works on various types of mobile devices.
What should you recommend?
You are using Dynamics 365 Sales.
You need to pull data into a Power BI report for your team. The City and State columns must be combined to form one column on the report.
Which function would you use? Each correct answer presents a complete solution. NOTE: Each correct selection is worth one point.
DRAG DROP
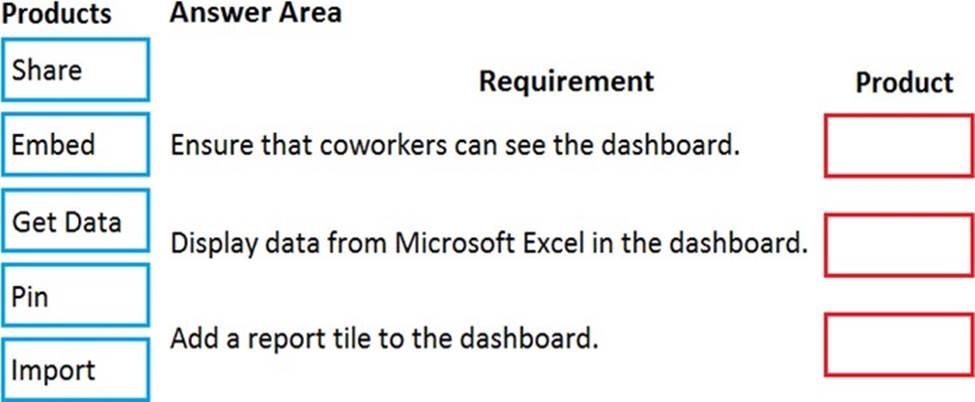
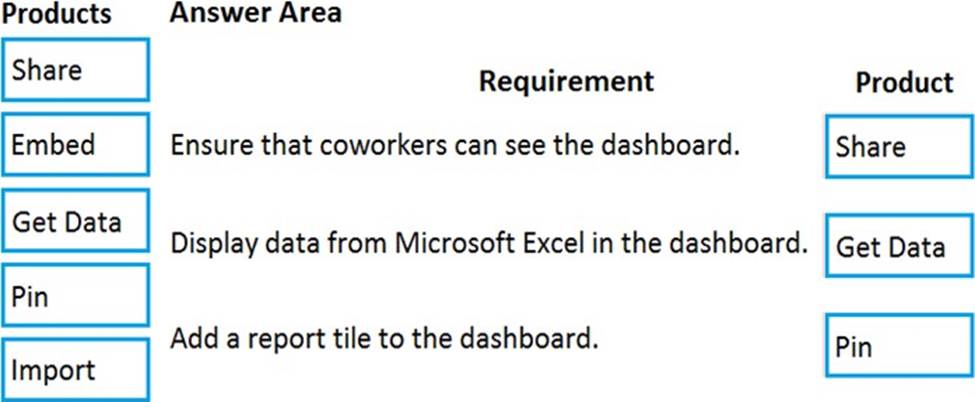
You create a Power BI dashboard.
Match each option to its function. To answer, drag the appropriate option from the column on the left to its function on the right. Each option may be used once, more than once, or not at all. NOTE: Each correct match is worth one point.
You create a set of dashboards and reports for a project team that combines data from different sources in Power BI. Some of the data is considered sensitive.
You need to distribute the dashboards and reports securely to the team.
What should you create?