
매달, 우리는 1000명 이상의 사람들이 시험 준비를 잘하고 시험을 잘 통과할 수 있도록 도와줍니다.
Quality Engineer Exam 온라인 연습
최종 업데이트 시간: 2025년10월10일
당신은 온라인 연습 문제를 통해 ASQ CQE 시험지식에 대해 자신이 어떻게 알고 있는지 파악한 후 시험 참가 신청 여부를 결정할 수 있다.
시험을 100% 합격하고 시험 준비 시간을 35% 절약하기를 바라며 CQE 덤프 (최신 실제 시험 문제)를 사용 선택하여 현재 최신 160개의 시험 문제와 답을 포함하십시오.
정답:
Explanation:
Robust design focuses on improving product and process designs to be less sensitive to variations, such as ambient temperature changes.
Adjusting machine settings to maintain consistent seal strength despite temperature fluctuations is an example of making a process more robust.
Robust design techniques aim to ensure that products and processes perform reliably under varying conditions.
Reference: "Taguchi's Quality Engineering Handbook" explains the principles of robust design and its application in manufacturing.
정답:
Explanation:
The authority for customer audits at a supplier’s facility is typically outlined in contracts or purchasing agreements.
These documents specify the terms and conditions under which the supplier agrees to allow audits by the customer.
Quality management system documents and certificates of conformance do not usually grant audit authority.
Reference: The ASQ "Auditing Handbook" and ISO 9001 standards emphasize that contractual agreements define the rights and obligations regarding audits.
정답:
Explanation:
Process capability analysis evaluates how well a process can produce output within specified limits.
It measures the inherent variability of a process relative to its specification limits.
This analysis is valuable for comparing the capabilities of different processes or equipment to ensure they meet required specifications.
It helps in selecting the most appropriate process or equipment by providing quantitative data on their performance.
Reference: ASQ's "Certified Quality Engineer Handbook" outlines the use of process capability analysis for comparing processes and equipment.
정답:
Explanation:
To determine the portion of the product expected to meet specification, we use the process capability.
Given:
Mean (X̄)= 101
Range (R) = 4
Sample size (n) = 5
Specification = 100 ± 3 (i.e., 97 to 103)
First, calculate the standard deviation (σ) using the average range (R̄)and a factor (d2) from standard tables for n = 5, where d2 = 2.326:
σ = R̄/ d2 = 4 / 2.326 ≈ 1.72
Next, convert the specification limits to Z-scores:
Lower Z = (97 - 101) / 1.72 ≈ -2.33 Upper Z = (103 - 101) / 1.72 ≈ 1.16
Using standard normal distribution tables, the area between these Z-scores corresponds to the portion within specification:
Portion within specification ≈ P(-2.33 < Z < 1.16) ≈ 0.954 or 95.4%
Reference: Montgomery, D.C. (2009). Introduction to Statistical Quality Control. Wiley.
ASQ. (n.d.). Process Capability Indices. Retrieved from https://asq.org/quality-resources/process-capability
정답:
Explanation:
A criticality analysis is used to classify or determine the safety and quality characteristics of a product or process. This analysis evaluates the severity, occurrence, and detection of potential failures, helping to prioritize issues that could significantly impact safety and quality.
Reference: Stamatis, D.H. (2003). Failure Mode and Effect Analysis: FMEA from Theory to Execution. ASQ Quality Press.
IEC 60812:2018. (2018). Analysis techniques for system reliability C Procedure for failure mode and effects analysis (FMEA).
정답:
Explanation:
Buy-in at all levels of management is critical for the success of quality initiatives. When all management levels are aligned and supportive of quality goals, it ensures that these initiatives are prioritized and integrated into daily operations. This comprehensive support fosters a culture of quality throughout the organization, making it easier to implement and sustain quality improvements.
Reference: Juran, J.M., & Gryna, F.M. (1993). Quality Planning and Analysis: From Product Development through Use. McGraw-Hill.
Deming, W.E. (1986). Out of the Crisis. MIT Press.
정답:
Explanation:
The expected number of rejects per sample can be calculated using the reject rate and the sample size. Given a reject rate of 6% (or 0.06) and a sample size of 5: Expected number of rejects per sample = 0.06 * 5 = 0.3
Reference: Montgomery, D.C. (2009). Introduction to Statistical Quality Control. Wiley.
ASQ. (n.d.). Basic Quality Tools. Retrieved from https://asq.org/quality-resources/basic-quality-tools
정답:
Explanation:
A tree diagram is a tool used to break down broad goals into increasingly detailed levels. It starts with a central concept and branches out into finer levels of detail, similar to the structure of a tree. This helps in understanding the various components of a goal and how they relate to one another, facilitating a step-by-step approach to achieving the objective.
Reference: ASQ (American Society for Quality). (n.d.). Tree Diagram. Retrieved from https://asq.org/quality-resources/tree-diagram
Tague, N.R. (2004). The Quality Toolbox. ASQ Quality Press.
정답:
Explanation:
Management commitment is the most crucial aspect of a successful quality improvement effort. Without the active involvement and support of management, quality initiatives are less likely to receive the necessary resources, attention, and prioritization. Management commitment includes setting clear quality goals, providing the required resources, and leading by example to foster a culture of continuous improvement. This ensures that quality improvement is integrated into the organizational strategy and receives ongoing support and reinforcement.
Reference: Juran, J.M., & Gryna, F.M. (1993). Quality Planning and Analysis: From Product Development through Use. McGraw-Hill.
Crosby, P.B. (1979). Quality is Free. McGraw-Hill.
정답:
Explanation:
A check sheet is a structured, prepared form for collecting and analyzing data.
It is one of the seven basic quality tools used to record frequency of events or defects, making it ideal for showing frequency distribution.
Affinity diagrams and interrelationship digraphs are used for organizing ideas and identifying relationships, while a PERT chart is used for project scheduling.
Reference: The ASQ and various quality management textbooks, such as "The Quality Toolbox" by Nancy R. Tague, outline the use of check sheets for frequency distribution analysis.
정답:
Explanation:
Error-proofing, or "poka-yoke," is a technique used to prevent errors by designing processes, equipment, or fixtures to avoid mistakes.
Fixture design involves creating jigs, fixtures, or tooling that ensure parts are correctly positioned and assembled, thereby preventing errors.
Housekeeping, equipment calibration, and double sampling do not inherently prevent errors by design.
Reference: The concept of error-proofing is detailed in quality engineering literature, such as "Poka-Yoke: Improving Product Quality by Preventing Defects" by Shigeo Shingo.
정답:
Explanation:
FMEA prioritizes failure modes based on their Risk Priority Number (RPN), calculated as Severity x Occurrence x Detection.
Calculating RPN for each failure mode:
Failure Mode 1: 10 x 5 x 8 = 400
Failure Mode 2: 7 x 9 x 6 = 378
Failure Mode 3: 10 x 5 x 9 = 450
Failure Mode 4: 6 x 9 x 9 = 486
Failure Mode 3 has the highest RPN of 450, indicating it should be prioritized first for mitigation efforts.
Reference: FMEA guidelines, such as those from the AIAG (Automotive Industry Action Group), recommend addressing the highest RPN values first to reduce risk.
정답:
Explanation:
Severity in the context of software quality and risk management refers to the extent of impact a failure would have on a system or process.
It assesses the consequences of a failure, regardless of its likelihood or detectability.
High severity indicates significant detrimental effects, such as critical system failures or safety hazards.
Reference: The ASQ and FMEA (Failure Mode and Effects Analysis) methodology define severity as the measure of the seriousness of the effect of a failure mode.
정답:
Explanation:
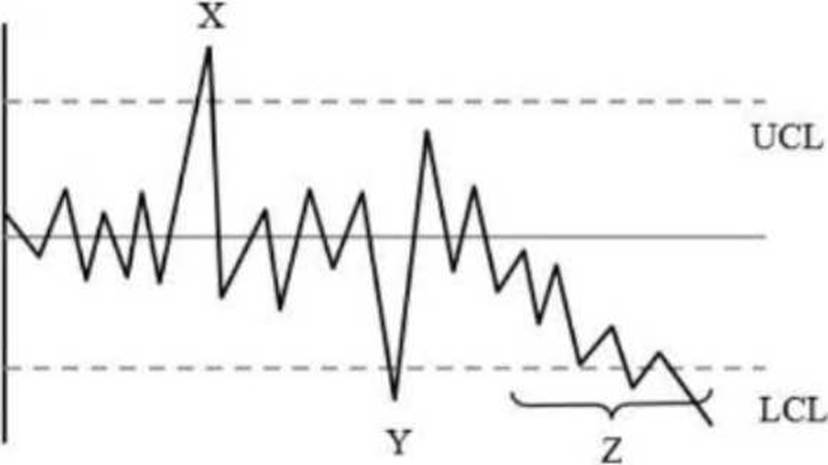
The chart provided is a control chart used to monitor process variation over time.
Control charts have upper control limits (UCL) and lower control limits (LCL) that represent the threshold of acceptable variation.
Points X and Y, which lie outside the control limits, indicate special causes of variation. These are deviations caused by specific, identifiable factors rather than inherent process noise.
Region Z, where data points are consistently below the mean and approaching the LCL, suggests a trend indicating a shift due to special causes.
Reference: According to ISO 9001 and the ASQ, control charts are utilized to detect special causes of variation, which signal that a process is out of control and requires investigation.
정답:
Explanation:
In software quality engineering, data can be classified as either numerical or non-numerical.
Numerical data can be measured and expressed in numbers, such as weight, height, and temperature.
Non-numerical data, also known as categorical data, represents characteristics or attributes that cannot be measured in numbers.
Such data is described as "qualitative" because it pertains to qualities rather than quantities.
Reference: The ASQ (American Society for Quality) defines qualitative data as data that approximates or characterizes but does not measure attributes, properties, or characteristics of a phenomenon.