
매달, 우리는 1000명 이상의 사람들이 시험 준비를 잘하고 시험을 잘 통과할 수 있도록 도와줍니다.
Tableau Desktop Specialist Exam 온라인 연습
최종 업데이트 시간: 2025년11월17일
당신은 온라인 연습 문제를 통해 Tableau Desktop Specialist 시험지식에 대해 자신이 어떻게 알고 있는지 파악한 후 시험 참가 신청 여부를 결정할 수 있다.
시험을 100% 합격하고 시험 준비 시간을 35% 절약하기를 바라며 Desktop Specialist 덤프 (최신 실제 시험 문제)를 사용 선택하여 현재 최신 151개의 시험 문제와 답을 포함하십시오.
정답:
Explanation:
By default, all of the above mentioned are stored in Documents -> My Tableau Repository
Reference: https://help.tableau.com/current/pro/desktop/en-us/environ_filesandfolders.htm
정답:
Explanation:
According to the official Tableau documentation, there are 5 types of trend lines which we can work with in Tableau:
1) Linear Trend Line
2) Logarithmic Trend Line
3) Exponential Trend Line
4) Polynomial Trend Line
5) Power Model
Hence, the correct answer is BINOMIAL trend line which is not present in Tableau. See the following image:

For more information, refer to: https://help.tableau.com/current/pro/desktop/enus/trendlines_add.htm
정답:
Explanation:
Explanation Pretty common question on the Tableau Desktop Specialist exam.
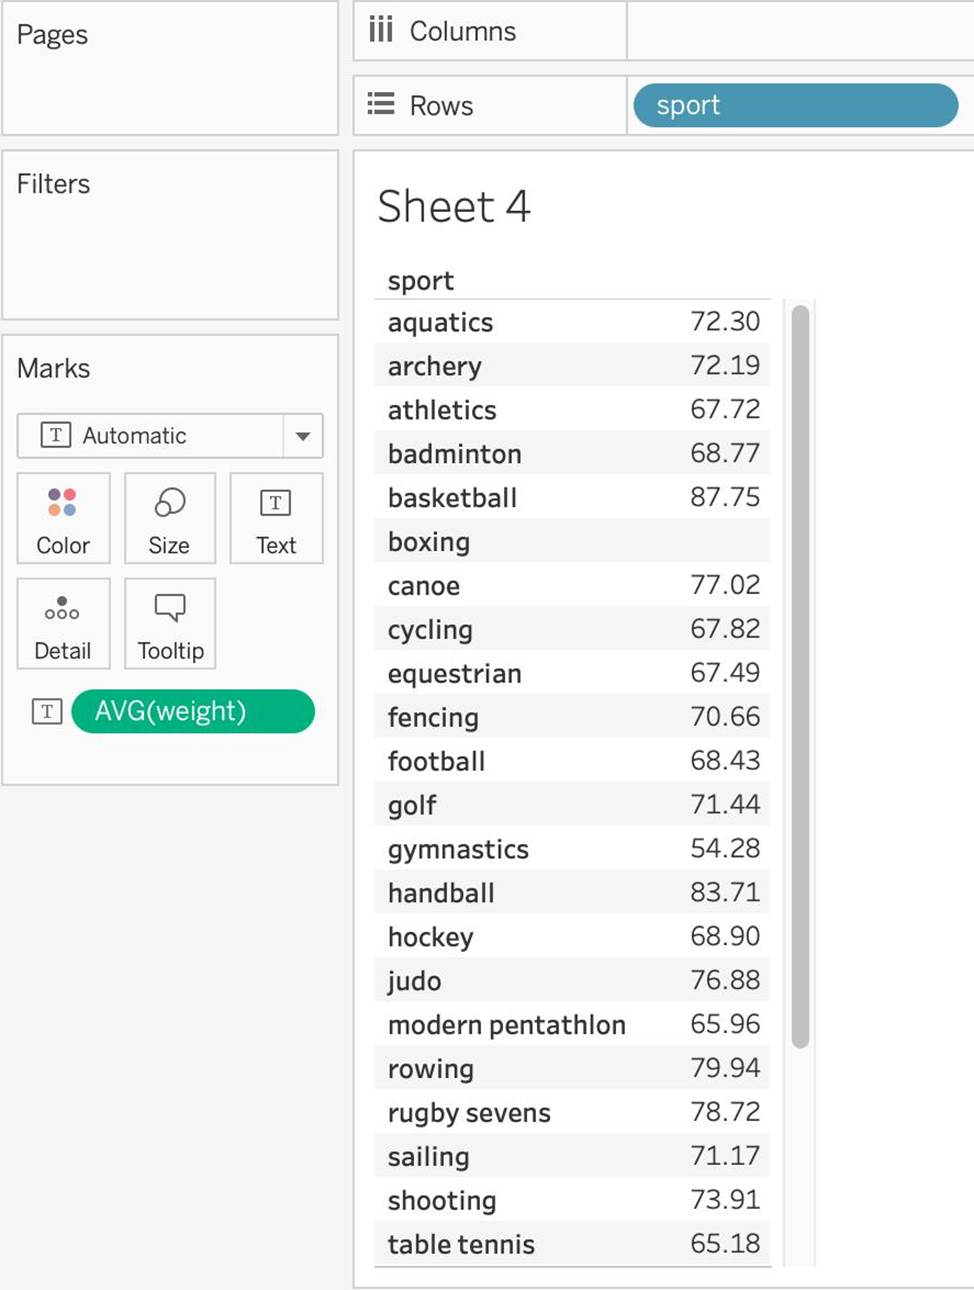
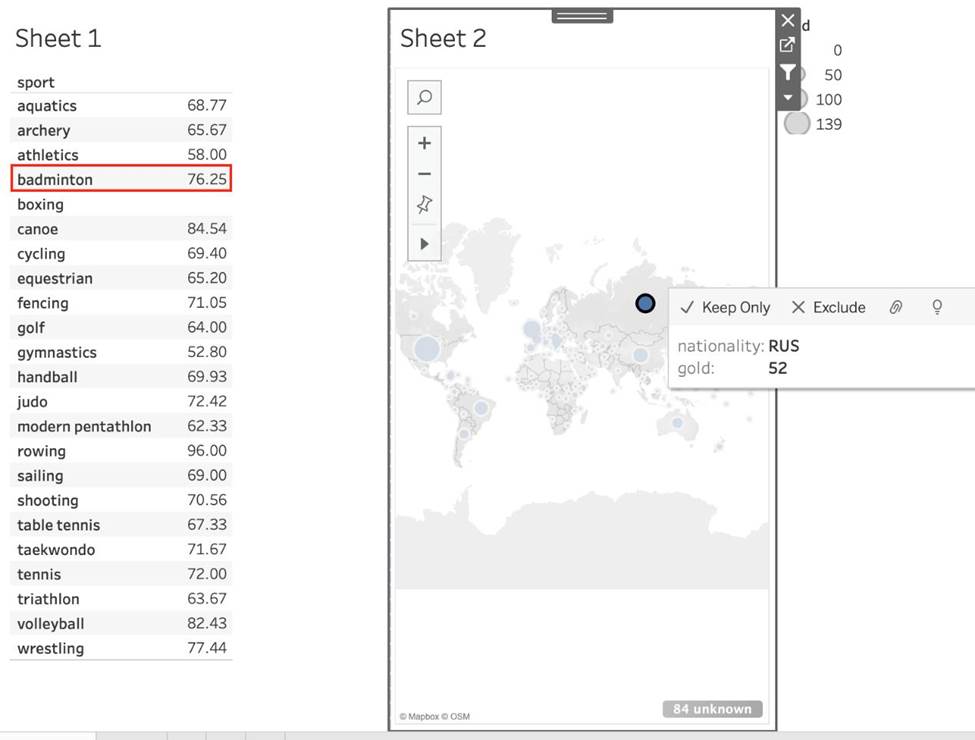
1) First, lets create Sheet 1. For this, drag sport to the Row shelf, and Weight to the Text mark in the Marks shelf. Change its aggregation to Average:
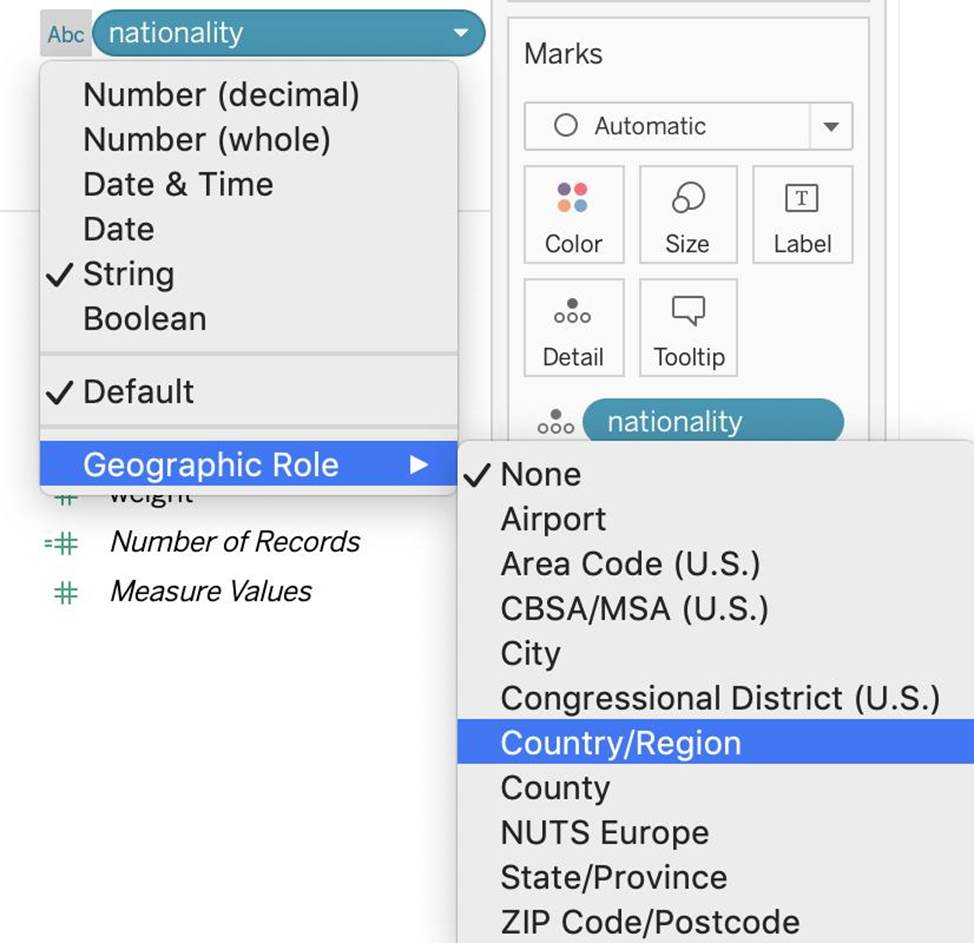
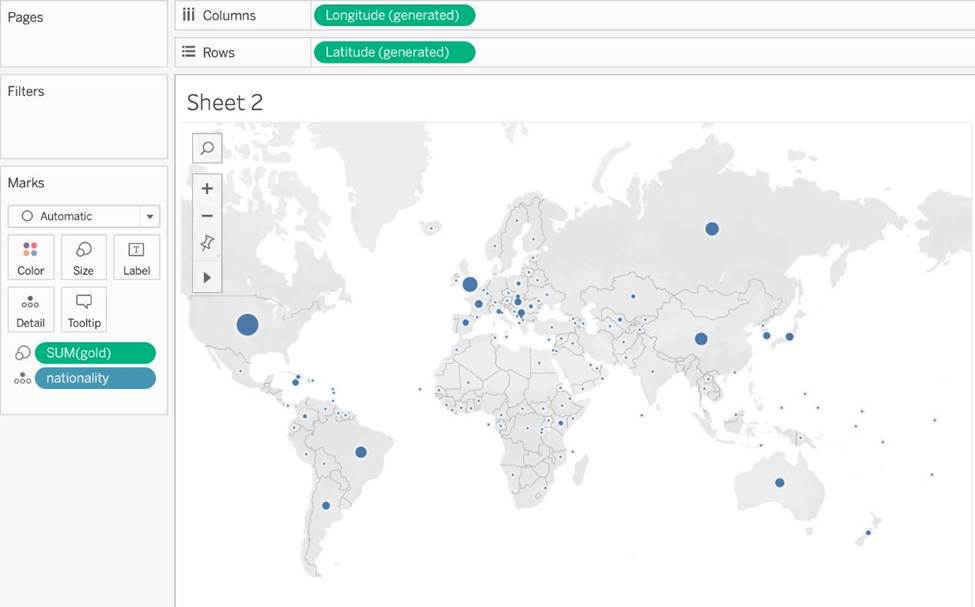
2) Now, for sheet 2 - Drag nationality to the view, and gold to the size mark in the Marks shelf.
NOTE: Depending on your version of Tableau, you may need to assign a Geographical role to the nationality column first as follows:
3) Now, let's create a dashboard, and use both these sheets in it:
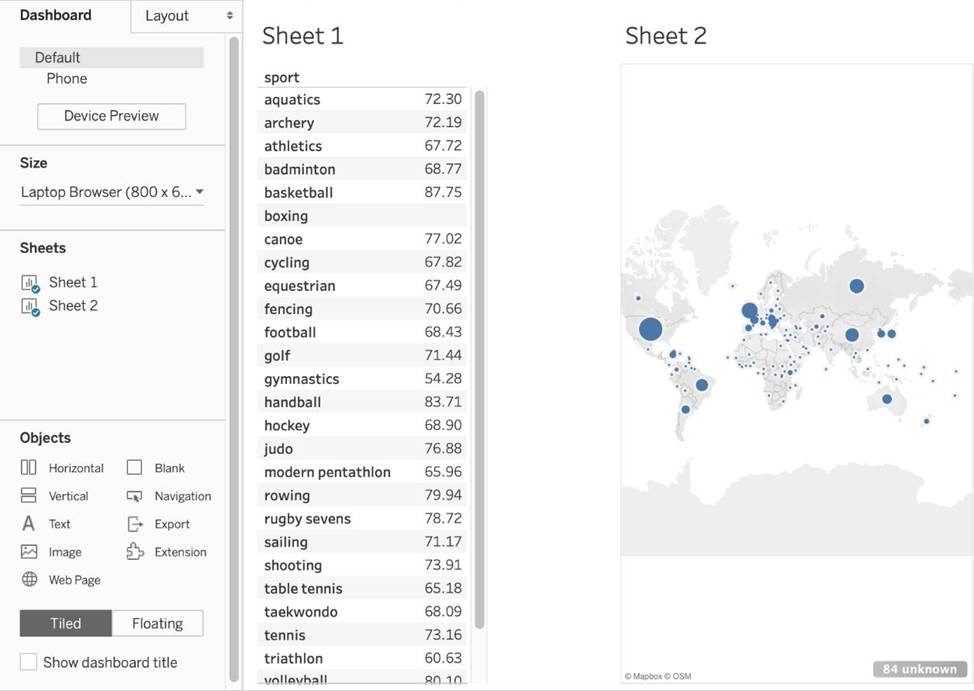
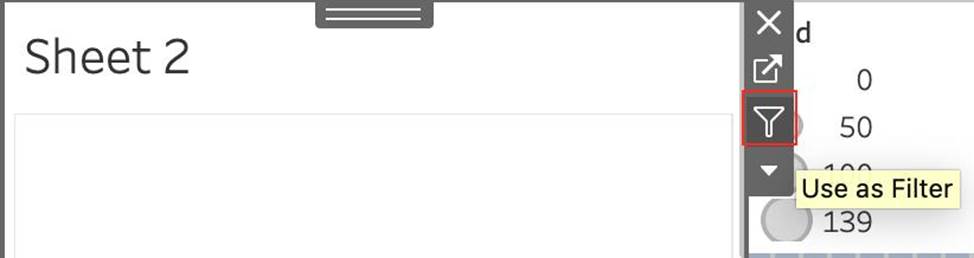
4) Now, for the most Important step, use SHEET 2 AS A FILTER FOR SHEET 1 as follows: Now simply click on Russia in Sheet 2, and Sheet 1 will automatically update as follows:
정답:
Explanation:
Relative date filters dynamically update to show a time period relative to when you open the view, such as the current week, the year to date, or the past 10 days. Relative date filters make it easy to create views that always show the most recent data.
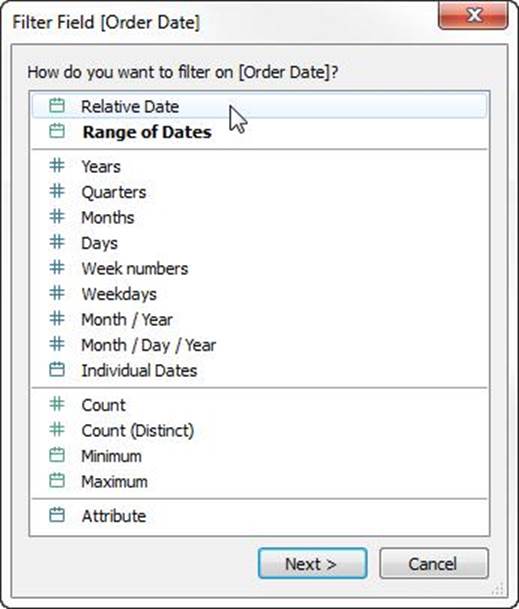
Step 1: Drag a date field to the filter shelf Right-click (control-click on Mac) and drag a date field from the Data window to the Filters shelf. In the Filter Field dialog box, click Relative Date, and then click Next.
Step 2: Select a time unit In the Filter dialog box, click Relative dates, and then select the unit of time for the filter. For example, to show only the three most recent weeks, select Weeks.
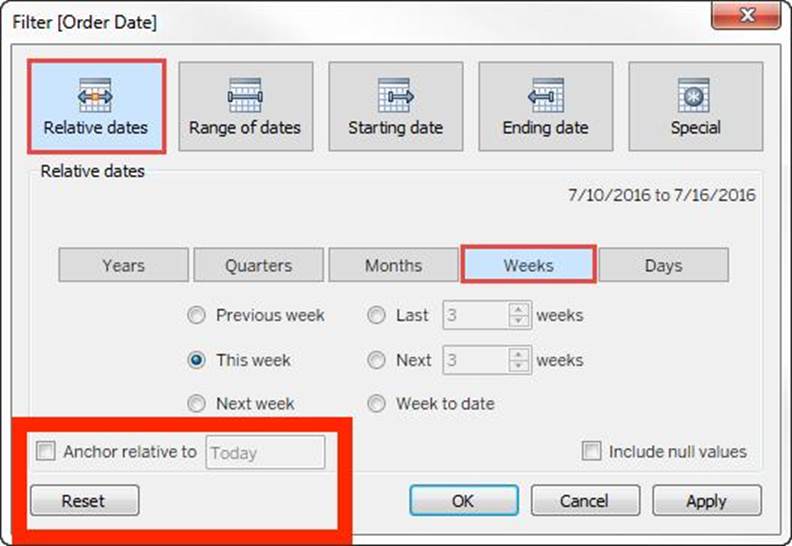
Here, you can clearly see that the default date is TODAY
Reference: https://help.tableau.com/current/pro/desktop/en-us/qs_relative_dates.htm
정답:
Explanation:
The following are the official definitions from the Tableau documentation for the various file types:
1). tds (Tableau Data Source) - To not contain the actual data but rather the information necessary to connect to the actual data as well as any modifications you've made on top of the actual data such as changing default properties, creating calculated fields etc. (CORRECT ANSWER)
2). twbx (Tableau packaged workbook) - To create a single zip file that contains a workbook along with any supporting local file data and background images. This is great for sharing your work with others who don’t have access to the original data.
3) Extract (. hyper or .tde) C To create a local copy of a subset or entire data set that you can use to share data with others, when you need to work offline, and improve performance.
3) (.twb) Workbooks C To hold one or more worksheets, plus zero or more dashboards and stories.
Reference: https://help.tableau.com/current/pro/desktop/en-us/environ_filesandfolders.htm
정답:
Explanation:
You don't need to know ANY programming language to use quick table calculations!
Follow along with the steps below to learn how to apply a quick table calculation to a visualization:
1) Open Tableau Desktop and connect to the Sample-Superstore data source, which comes with Tableau.
2) Navigate to a new worksheet.
3) From the Data pane, under Dimensions, drag Order Date to the Columns shelf.
4) From the Data pane, under Dimensions, drag State to the Rows shelf.
5) From the Data pane, under Measures, drag Sales to Text on the Marks Card.
6) From the Data pane, under Measures, drag Profit to Color on the Marks Card.
7) On the Marks card, click the Mark Type drop-down and select Square.

The visualization updates to look like this:
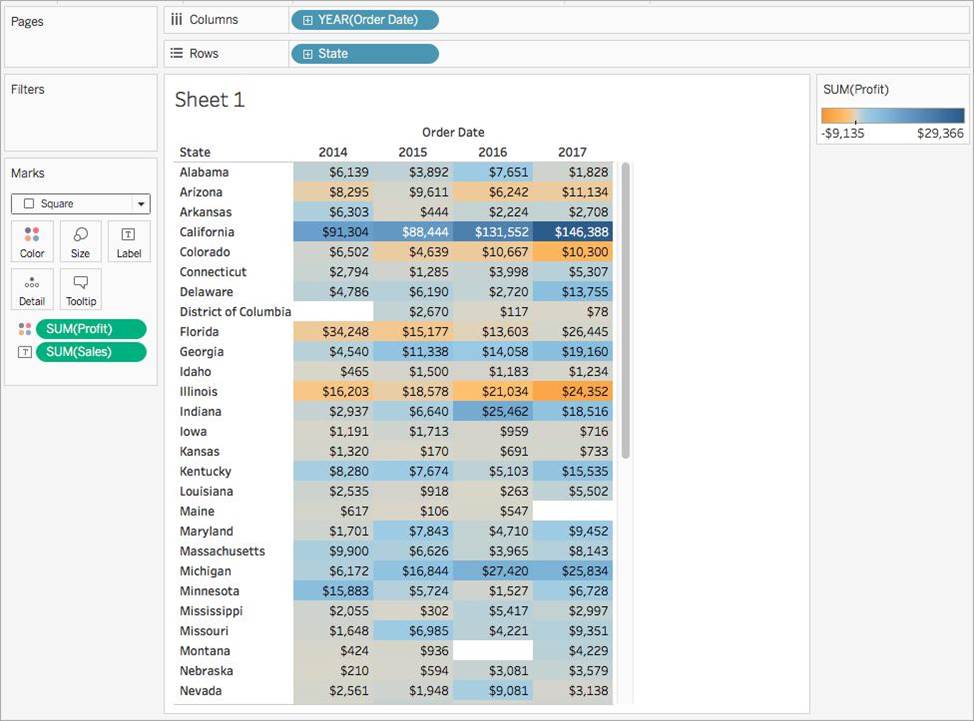
Apply the quick table calculation
1) On the Marks card, right-click SUM(Profit) and select Quick Table Calculation > Moving Average.
Note: You can only perform quick table calculations on measures in the view. A delta symbol appears on the field to indicate that a quick table calculation is being applied to the field. The colors in the visualization update to show the moving average of profit across the years.
Reference: https://help.tableau.com/current/pro/desktop/enus/calculations_tablecalculations_quick.htm
정답:
Explanation:
The following options are available when an image is Exported:
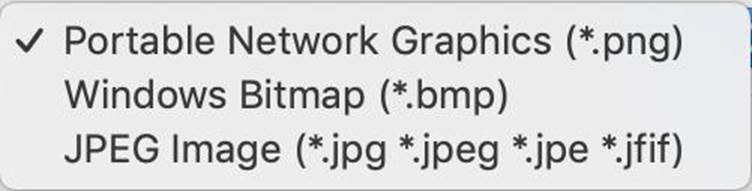
NOTE: When we Copy an image rather than exporting it, then the image is copied to the clipboard in the TIFF file format! However, it is not available when EXPORTING an image.
Reference: https://help.tableau.com/current/pro/desktop/en-us/save_export_image.htm
정답:
Explanation:
Explanation Extracts are advantageous for several reasons:
1) Supports large data sets: You can create extracts that contain billions of rows of data.
2) Fast to create: If you're working with large data sets, creating and working with extracts can be faster than working with the original data.
3) Help improve performance: When you interact with views that use extract data sources, you generally experience better performance than when interacting with views based on connections to the original data.
4) Support additional functionality: Extracts allow you to take advantage of Tableau functionality that's not available or supported by the original data, such as the ability to compute Count Distinct.
5) Provide offline access to your data: Extracts allow you to save and work with the data locally when the original data is not available. For example, when you are traveling.
To work with the MOST up-do-date data, use a live connection instead!
Reference: https://help.tableau.com/current/pro/desktop/en-us/extracting_data.htm
정답:
Explanation:
According to the official Tableau documentation:
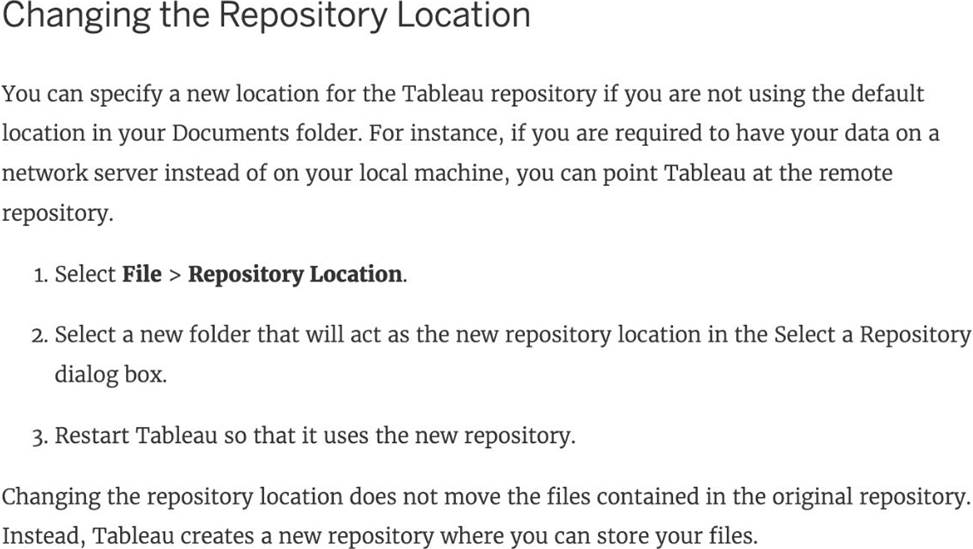
Reference: https://help.tableau.com/current/pro/desktop/en-us/environ_filesandfolders.htm
정답:
Explanation:
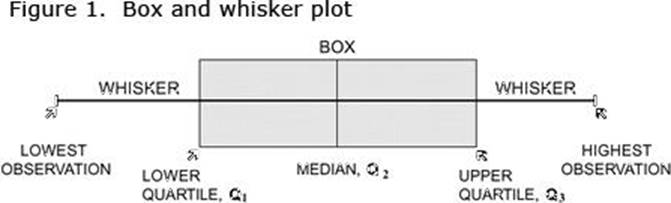
Explanation In a box and whisker plot:
1) The ends of the box are the upper and lower quartiles, so the box spans the interquartile range
2) The median is marked by a vertical line inside the box
3) The whiskers are the two lines outside the box that extend to the highest and lowest observations.
정답:
Explanation:
You can add a reference line to any continuous axis in the view. To add a reference line: Drag Reference Line from the Analytics pane into the view. Tableau shows the possible destinations. The range of choices varies depending on the type of item and the current view. In a simple case, the drop target area offers three options:
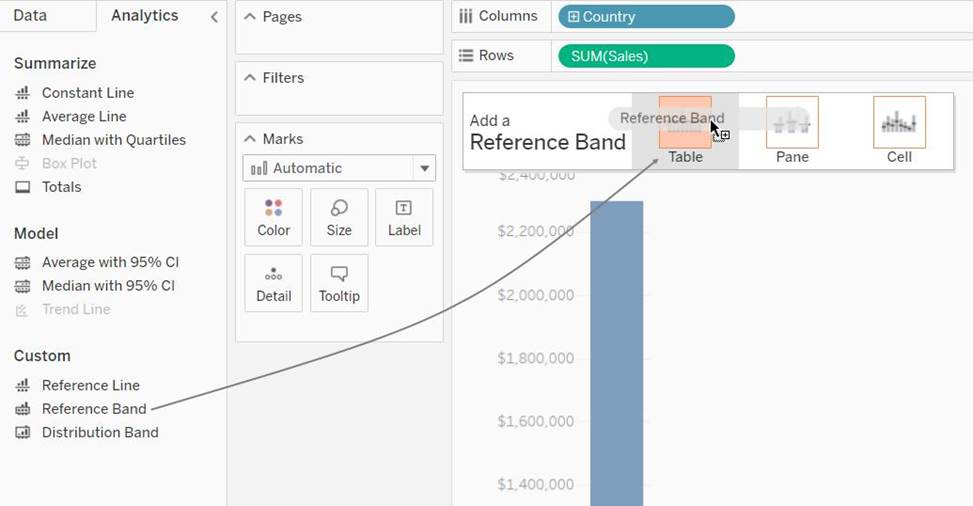
Reference: https://help.tableau.com/current/pro/desktop/en-us/reference_lines.htm
정답:
Explanation:
According to Tableau's order of operations, the Extract filter is right at the top of the hierarchy. The data filtered in the Extract is then passed on to what we see in the Data Pane. See below:
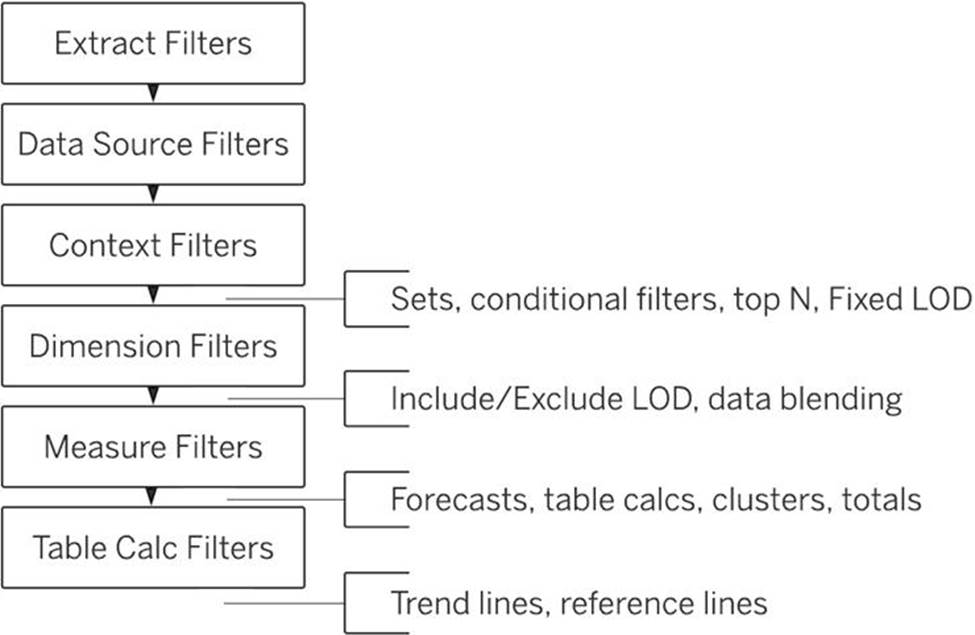
Reference: https://help.tableau.com/current/pro/desktop/en-us/order_of_operations.htm
정답:
Explanation:
Explanation Here's how to add image files to your repository:
1) Find image file on the internet. I try to find consistent image formats if I plan to use a set of shapes such as logos or flags.
2) Download the image to your computer.
3) Drag images into your My Documents -> My Tableau repository -> Shapes folder.
4) Open Tableau and your new shapes will automatically be included in your "edit shapes" menu.
Reference: https://www.tableau.com/about/blog/2016/2/how-use-custom-shapes-filtersyour-dashboard-50200
정답:
Explanation:
No, by default, animations are not enabled in Tableau. We can animate visualizations to better highlight changing patterns in your data, reveal spikes and outliers, and see how data points cluster and separate. Animations visually transition between filter, sort, and zoom settings, different pages, and
changes to filter, parameter, and set actions. As visualizations animate in response to these changes, viewers can more clearly see how data differs, helping them make better informed decisions.
When you author animations, you can choose between two different styles: simultaneous or sequential. Here are examples of each type.
1) Simultaneous animations
The default simultaneous animations are faster and work well when showing value changes in simpler charts and dashboards.
2) Sequential animations Sequential animations take more time but make complex changes clearer by presenting them step-by-step.
To Animate visualizations in a workbook:
1) Choose Format > Animations.
2) If you want to animate every sheet, under Workbook Default, click On. Then do the following:
For Duration, choose a preset, or specify a custom duration of up to 10 seconds. For Style, choose Simultaneous to play all animations at once or Sequential to fade out marks, move and sort them, and then fade them in.
3) To override workbook defaults for a particular sheet, change the settings under Selected Sheet.

Reference: https://help.tableau.com/current/pro/desktop/en-us/formatting_animations.htm
정답:
Explanation:
Tableau Data Extract (TDE) is a snapshot of the data that Tableau stores locally. Good for very large datasets of which we only need few fields. Performance is optimised because it queries its own database engine instead of the local data source. When you create an extract of your data, you can reduce the total amount of data by using filters and configuring other limits. After you create an extract, you can refresh it with data from the original data. When refreshing the data, you have the option to either do a full refresh, which replaces all of the contents in the extract, or you can do an incremental refresh, which only adds rows that are new since the previous refresh.
Extracts are advantageous for several reasons:
1) Supports large data sets: You can create extracts that contain billions of rows of data.
2) Fast to create: If you're working with large data sets, creating and working with extracts can be faster than working with the original data.
3) Help improve performance: When you interact with views that use extract data sources, you generally experience better performance than when interacting with views based on connections to the original data.
4) Support additional functionality: Extracts allow you to take advantage of Tableau functionality that's not available or supported by the original data, such as the ability to compute Count Distinct.
5) Provide offline access to your data: Extracts allow you to save and work with the data locally when the original data is not available. For example, when you are traveling.