Analyzing and Visualizing Data with Microsoft Power BI 온라인 연습
최종 업데이트 시간: 2025년10월13일
당신은 온라인 연습 문제를 통해 Microsoft 70-778 시험지식에 대해 자신이 어떻게 알고 있는지 파악한 후 시험 참가 신청 여부를 결정할 수 있다.
시험을 100% 합격하고 시험 준비 시간을 35% 절약하기를 바라며 70-778 덤프 (최신 실제 시험 문제)를 사용 선택하여 현재 최신 147개의 시험 문제와 답을 포함하십시오.
/ 4
Question No : 1
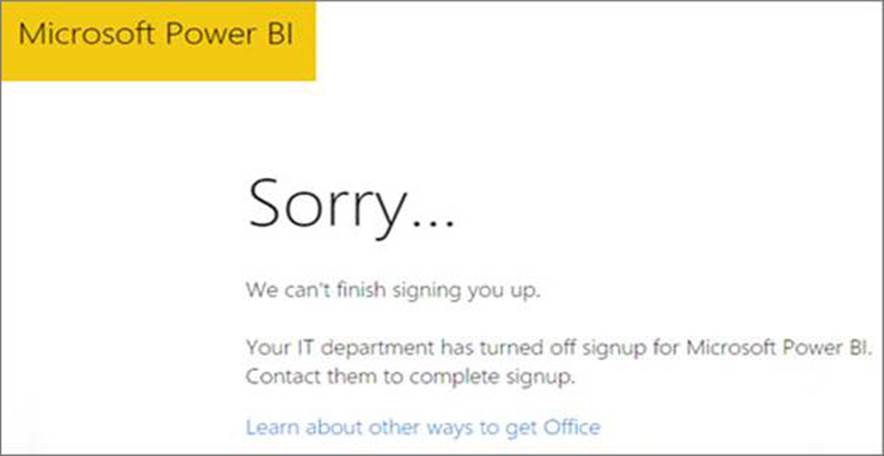
Your organization has a Microsoft Office 365 subscription.
When the users attempt to access the Power BI Service, they receive the error message shown in the exhibit. (Click the Exhibit button.)
You need to ensure that all the users can access the Power BI service.
What should you do first?
정답: Explanation:
You need to run the following cmdlet: Set-MsolCompanySettings -AllowAdHocSubscriptions $true
Question No : 2
HOTSPOT
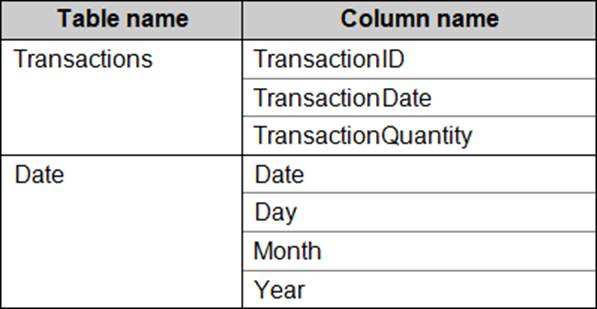
You have the following tables.
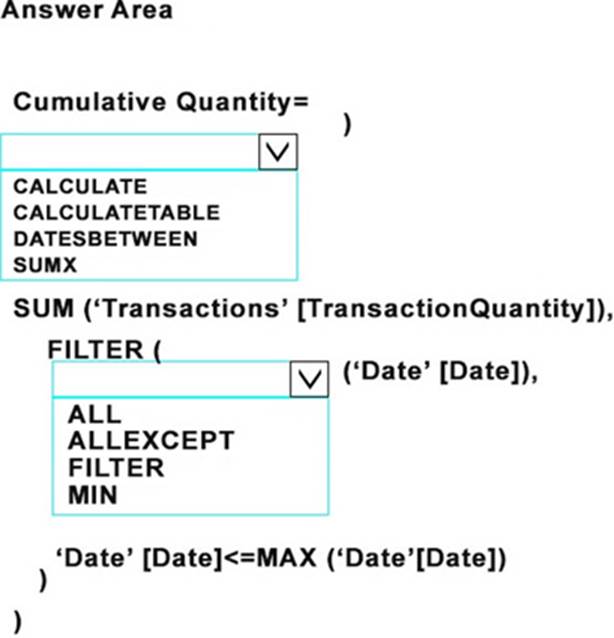
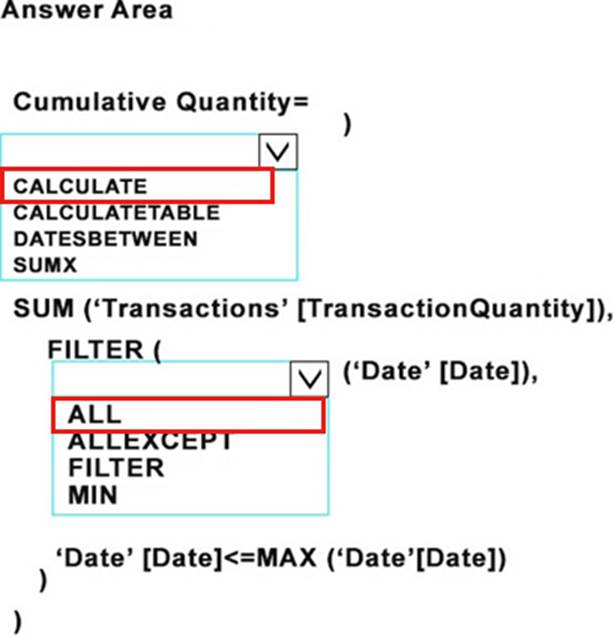
You need to create a measure to calculate a running total of TransactionQuantity.
How should you complete the DAX formula? To answer, select the appropriate options in the answer area.
NOTE: Each correct selection is worth one point.
You have a Power BI model for sales data.
You need to create a measure to calculate the year-to-date sales and to compare those sales to the previous year for the same time period.
Which DAX function should you use?
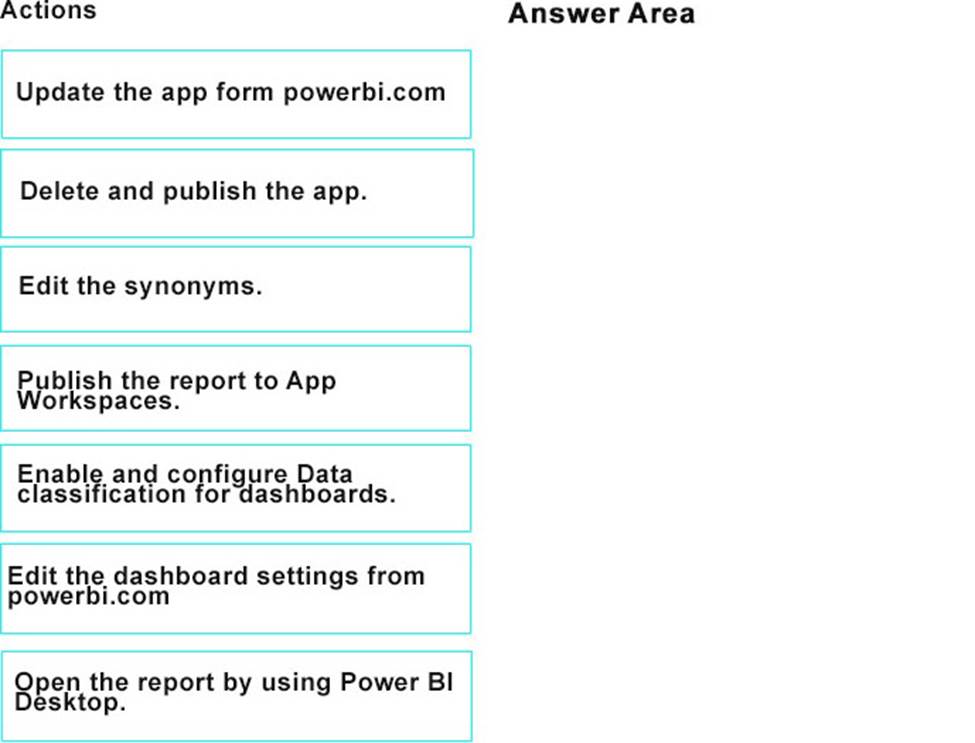
DRAG DROP
From Power BI Desktop, you publish an app that contains one dashboard and one report. Q&A is enabled on the dashboard.
In Q&A, a user types the query count of clients and fails to receive any results. The user then types the query count of subscribers and received the expected results.
You need to ensure that the user can use both queries to receive the same results.
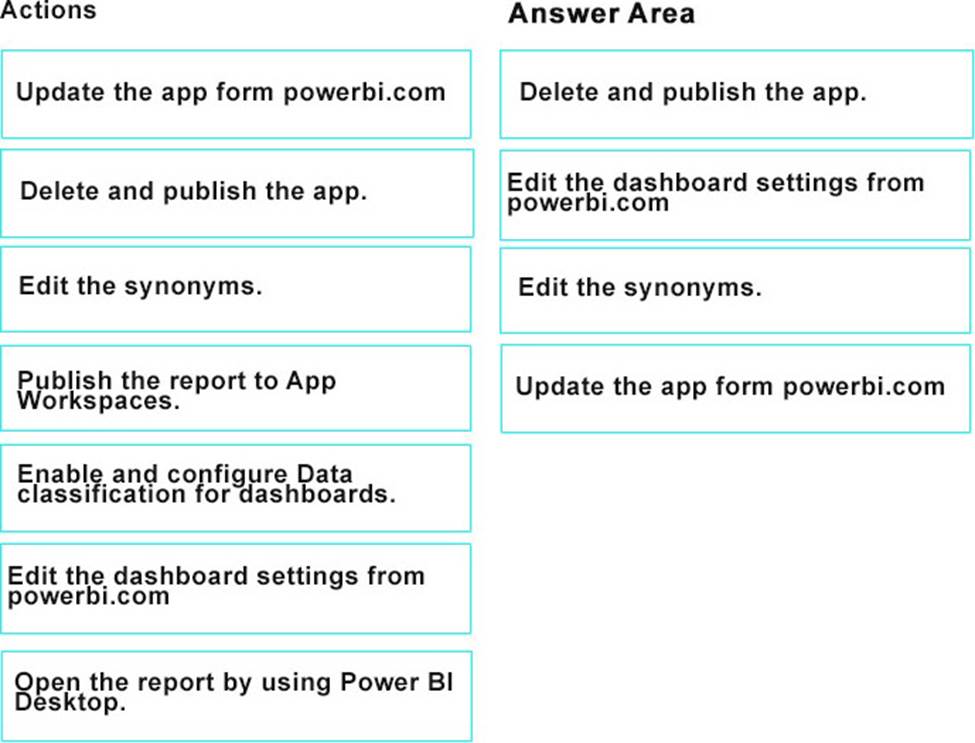
Which four actions should you perform in sequence? To answer, move the appropriate actions form the list of actions to the answer area and arrange them in the correct order.
정답:
Question No : 5
You have a power BI model that contains the following tables:
- Assets( AssetsID, AssetName, Purchase_DateID, Value)
- Date( DateID, Date, Month, Week, Year)
The tables have relationship. Date is marked as a date table in the Power BI model.
You need to create a measure to calculate the percentage that the total assets value increased since one year ago.
Which DAX formula should you use?
HOTSPOT
You have a Power BI model that has the following tables:
- Sales (Order_id, Order_Date, Product_id, Salesperson_id, Sales_Amount)
- Salesperson (Salesperson_id, Salesperson_name, address)
- Product (Product_id, Product_Name)
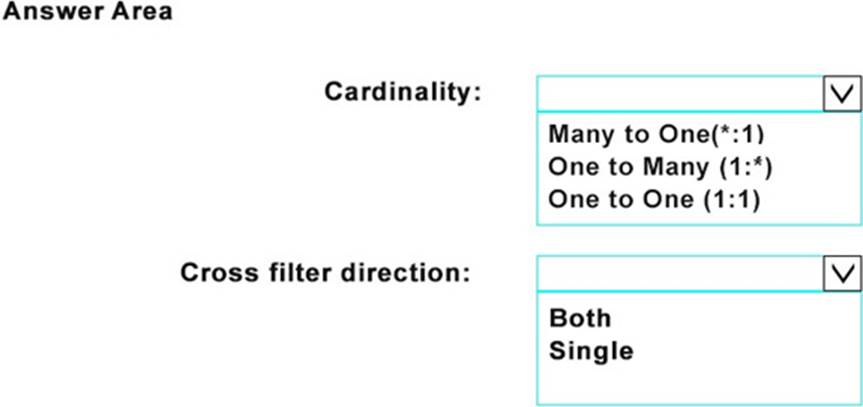
You need to create the following relationships:
- Sales to Product
- Sales to Sales person
You need to ensure that you can create a report that displays the count of products sold by each salesperson.
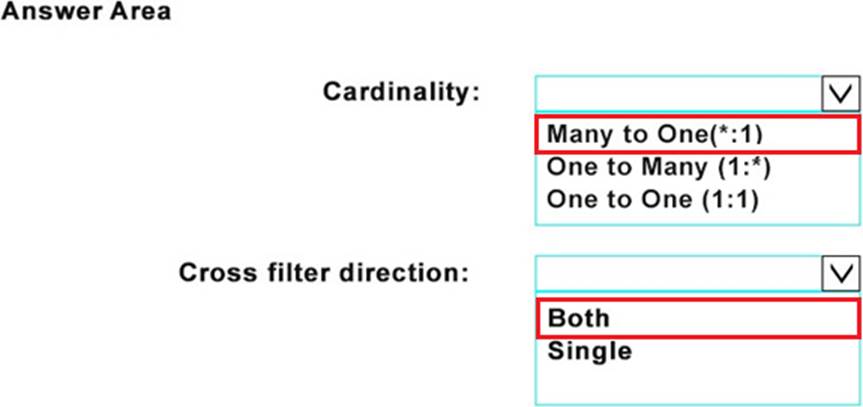
How should you configure the relationships? To answer, drag the appropriate options in the answer area.
NOTE: Each correct selection is worth one point.
You have a Power BI report in an app workspace.
You plan to embed a report from the app workspace into a line-of-business application by using Power BI Embedded.
Which information should you provide to the application developers?
You have a Power BI report that is configured to use row-level security (RLS).
You have the following roles:
- A manager role that limits managers to see only the sales data from the stores they manage.
- A region role that limits users to see only the data from their respective region
You plan to use Power BU Embedded to embed the report into an application. The application will authenticate the users.
You need to ensure that RLS is enforced when accessing the embedded report.
What should you do?
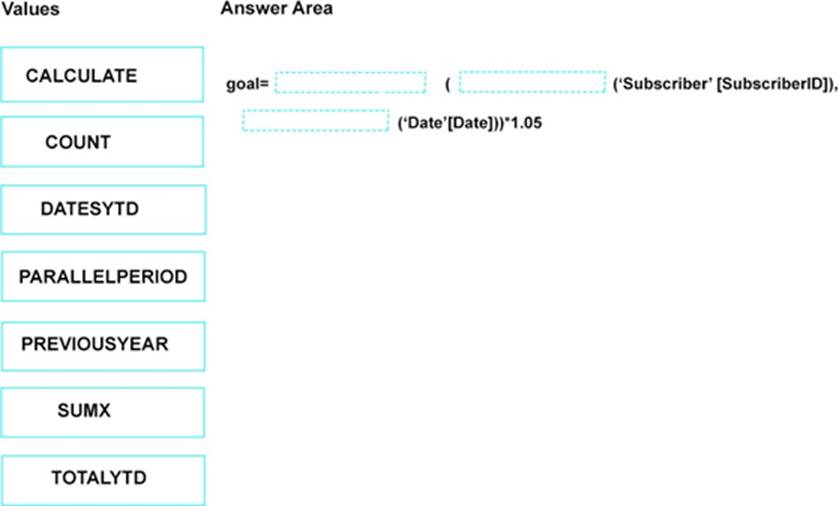
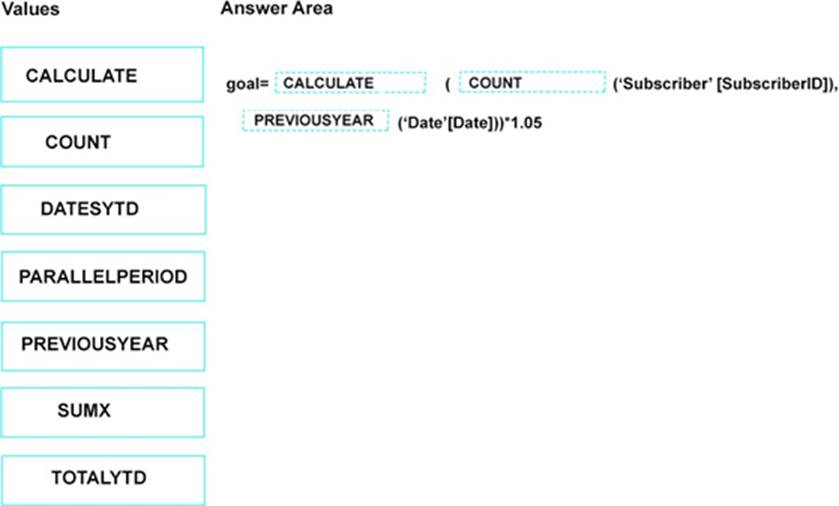
DRAG DROP
You have the following two tables:
• Subscriber (SubscriberlD, Enroll mentDate, ServicePlan)
• Date (Date, Month, Week, Year)
There is a relationship between Subscriber [EnrollmentDate] and Date[Date].
You plan to create a KPI for the number of subscribers enrolled in the current year.
You need to create a goal that is five percent more than the number of subscribers enrolled during the previous calendar year.
How should you complete the DAX formula? To answer, drag the appropriate values to the correct targets. Each value may be used once, more than once, or not at all. You may need to drag the split bar between panes or scroll to view content.
NOTE: Each correct selection is worth one point.
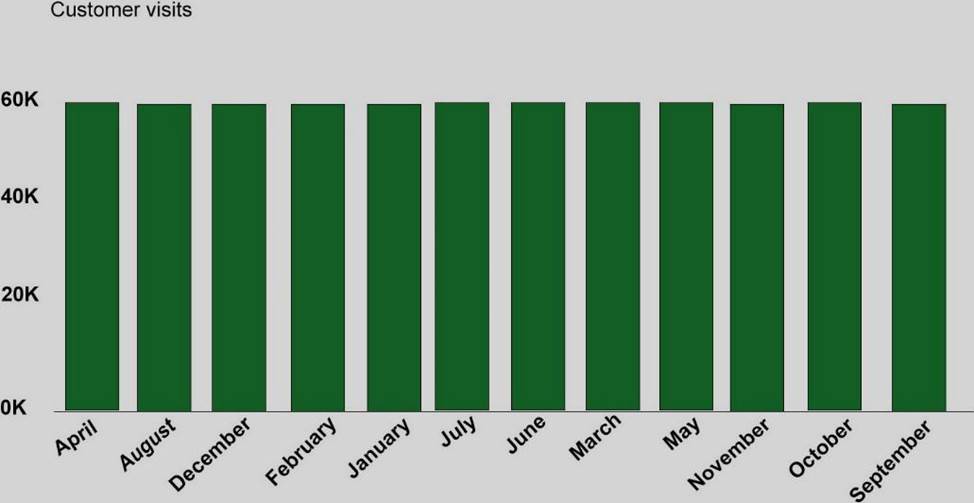
You have two tables named CustomerVisits and Date in a Power BI model.
You create a measure to calculate the number of customer visits.
You use the measure in the report shown in the exhibit. (Click the Exhibit.)
You discover that the total number of customer visits was 60,000, and that there were only 5,000 customer visits in August.
You need to fix the report to display the correct data for each month.
What should you do?
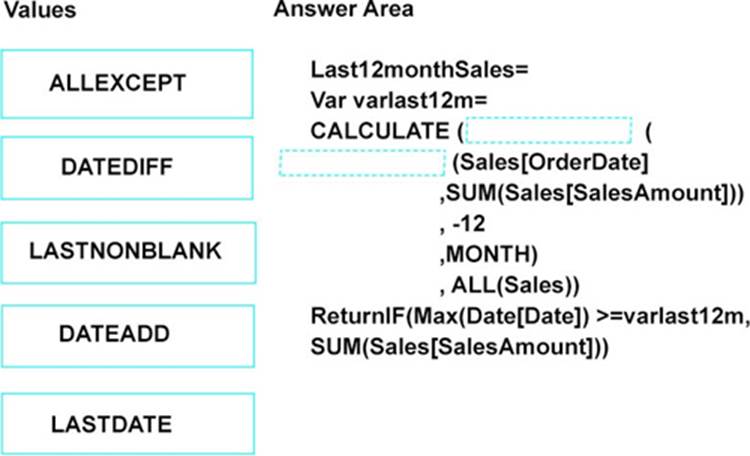
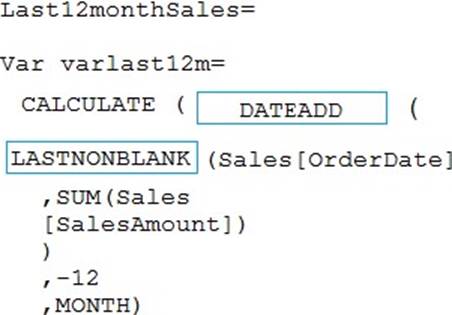
DRAG DROP
You have a Power BI model that contains a table named Sales. Sales contains columns named SalesAmount, OrderDate, SalesPerson, and OrderID.
You need to create a measure to calculate the last 12 months of sales. You must start from the last date a sale was made and ignore any filters set on the report.
How should you complete the DAX formula? To answer, drag the appropriate values to the correct targets. Each value may be used once, more than once, or not at all. You may need to drag the split bar between panes or scroll to view content.
NOTE: Each correct selection is worth one point.
You have a Power BI model that contains the following tables:
- Sales (Sales_ID, DateID, sales_amount)
- Date (DateID, Date, Month, week, Year)
The tables have a relationship. Date is marked as a date table in the Power BI model.
You need to create a measure to calculate the sales for the last 12 months.
Which DAX formula should you use?
You have a Power BI report that displays a bar chart and a donut chart on the same page. The bar chart shows the total sales by year and the donut chart shows the total sale by category.
You need to ensure that when you select a year on the bar chart, the donut remains unchanged.
What should you do?
You have a Microsoft Excel 2016 workbook that has a Power Pivot model.
The model contains the following tables:
- Product (Product_id, Producct_Name)
- Sales (Order_id, Order_Date, Product_id, Selasperson_id, Sales_Amount)
- Salesperson (Salesperson_id, Salesperson_name, address)
The model has the following relationships:
- Sales to Product
- Sales to Salesperson
You create a new Power BI file and import the Power Pivot model.
You need to ensure that you can generate a report that displays the count of products sold by each salesperson.
What should you do before you create the report?
You plan to create a Power BI report.
You have the schema model shown in the exhibit. (Click the exhibit).
The model has the following relationships:
- Store the District based on DistrictID
- Sales to Store based on LocationID
- Sales to Date based on PeriodID
- Sales to Item based on ItemID
You configure row-level security (RLS) so that the district managers of the stores only see the sales from the stores they manage.
When the district managers view the sales report, they see Sales by Items for all stores.
You need to ensure that the district managers can see Sales by items for the stores they manage only.
How should you configure the relationship from Sales to Item?